Nelson Capital Management
The Yield Curve Inverts

Asset Management, Fixed Income, Investment Themes, The Economy, Wealth Management
October 10, 2019
Is a Recession Around the Corner?
The S&P 500 continues to flirt with all-time highs, in spite of some volatility driven by trade war or political headlines. As the current record-length economic expansion persists, the obvious questions are: how long can it continue, and what could bring about the next recession? Over the past 18 months, we have written about two potential recession indicators that we have been monitoring closely: the spread between the 2-year Treasury and 10-year Treasury yields and the year-over-year job growth numbers. A year-over-year job growth reading below 1% and a yield curve “inversion” (where the 10-year yield falls below the 2-year yield) are generally reliable indicators that portend an upcoming recession.
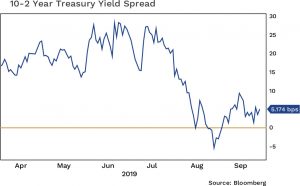
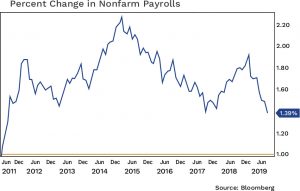 Year-over-year job growth remains comfortably over 1%, with the most recent reading at 1.39%. Still, it has decelerated over the last several months and so we continue to watch this closely as a sign of the health of the U.S. labor market. We witnessed inversions at other parts of the yield curve earlier this year (the 3-month/10-year spread went negative in March of 2019), but in late August we officially saw a negative spread between the 2-year and 10-year Treasury, the indicator we have been monitoring. Granted, the negative spread was only 5 basis points (0.05%), and only stayed negative for seven days before moving into positive territory. Nevertheless, it begs the question: is this the recession indicator we have been waiting for, or was it just a blip that can be explained away by a variety of external factors?
When we wrote last year about the possibility of a Fed-induced recession, we envisioned a scenario involving the Fed raising short-term interest rates too quickly and subsequently causing the yield curve to invert. However, the Fed has since made an abrupt reversal in its interest rate policy, cutting its benchmark target rate by 0.25% at its most recent policy meeting—the second cut this year— with yet another cut anticipated in 2019. Negative yielding debt abroad has made U.S. Treasuries more attractive, driving demand higher and bringing down the longer end of the yield curve. Therefore, the yield curve inversion was driven by falling long-term rates, not rising short-term rates. In other words, maybe it actually is different this time.
 Still, it is possible we could see the spread between the 2-year and 10-year yields turn negative again, and if it stays more dramatically inverted for longer, this will be a more convincing signal. Furthermore, we cannot help but worry that the existence of approximately $15 trillion in negative-yielding debt overseas might portend something more ominous. We have never before seen anything like this in history, so it is nearly impossible to predict what impact this negative-yielding debt might have, or how it might resolve.
We have seen the first hint of a yield curve inversion, a yellow flag
In the U.S., equity valuations remain fairly reasonable, the labor market is generally healthy, and corporate earnings are growing, albeit at a slower rate than in 2018, which had the benefit of the tax cut. The trade war with China is the largest overhang, and frequent headlines indicating a hint of resolution or deepening conflict should continue to swing the stock market one direction or the other. It seems logical to think that the Trump administration might want to reach a trade deal with China ahead of the election next year. But logic has not been a hallmark of this administration, and we do not feel that we can handicap this brand of uncertainty in this government-by-tweet environment.
 Globally, the trade war has led to a manufacturing slowdown, exacerbated by an ongoing deceleration in China GDP growth. The doubt surrounding the outcome of Brexit also remains a headwind that is halting business decisions and investment in Europe. The European Central Bank recently reignited its quantitative easing program, pledging indefinite stimulus in an effort to invigorate the ailing euro zone economy, although many doubt whether this will actually work. Inflation remains elusive, and in fact the value of real assets such as gold and other precious metals has risen alongside fears of deflation. In this year’s first quarter commentary, we wrote that it was time for a thoughtful evaluation of asset allocation. We remain convinced that now is a good time to make sure clients have appropriate liquidity. We have seen the first hint of a yield curve inversion, a yellow flag. Although we would not recommend acting on this alone, as it is still too early to predict a coming recession, we continue to tilt more toward value-oriented stocks that carry low price-to-earnings ratios and high dividend yields.
Individual investment positions detailed in this post should not be construed as a recommendation to purchase or sell the security. Past performance is not necessarily a guide to future performance. There are risks involved in investing, including possible loss of principal. This information is provided for informational purposes only and does not constitute a recommendation for any investment strategy, security or product described herein. Employees and/or owners of Nelson Roberts Investment Advisors, LLC may have a position securities mentioned in this post. Please contact us for a complete list of portfolio holdings. For additional information please contact us at 650-322-4000.
Receive our next post in your inbox.